Tag: infographic


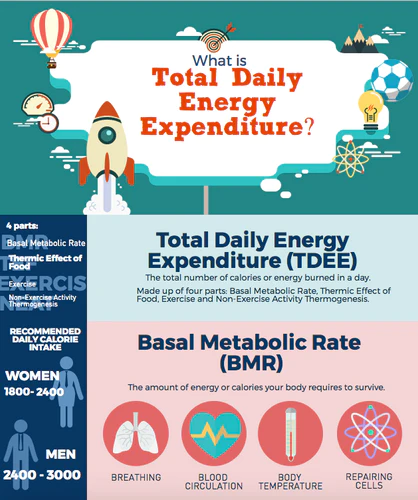
Happy Tuesday! Here’s our weekly infographic, this week’s topic: What is Total Daily Energy Expenditure?

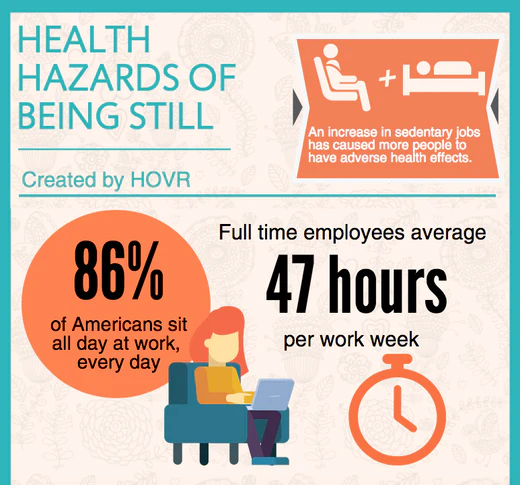
Here’s an infographic on the Health Hazards of Being Still:

With the steady rise of digital technology, sitting has become the most common posture in the workplace. Most desk workers spend an average of 10 hours a day sitting in front of a computer, which leaves very little opportunity for physical activity throughout the day. And unfortunately, as we’ve all been made aware, sitting can […]

We all deal with stress and anxiety—especially when we’re at work. Stress can have a massive impact on your work productivity, your relationships, and most importantly, your mental and physical health. In reality, stress isn’t all bad. For most people, it can be an effective motivator for success and self-improvement. But if you’re already experiencing […]